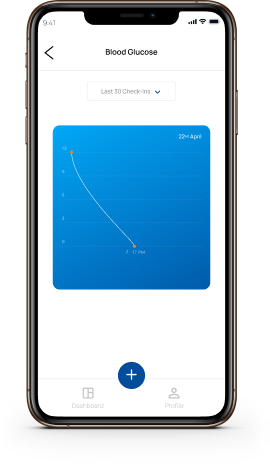
Pie charts, trend graphs, and scatter plots
Alerts are auto-generated when the patient's reading goes out of range
Group manager, caregiver, and end-user

Intuitive, easy to navigate and customize dashboard for caregivers and patient
Real-time data is easily accessed from any web browser including moblie devices.
Blood glucose, blood pressure & pulse, weight, SpO2 and temperature.


